Autonomous systems
Satellite-based solar panel detection
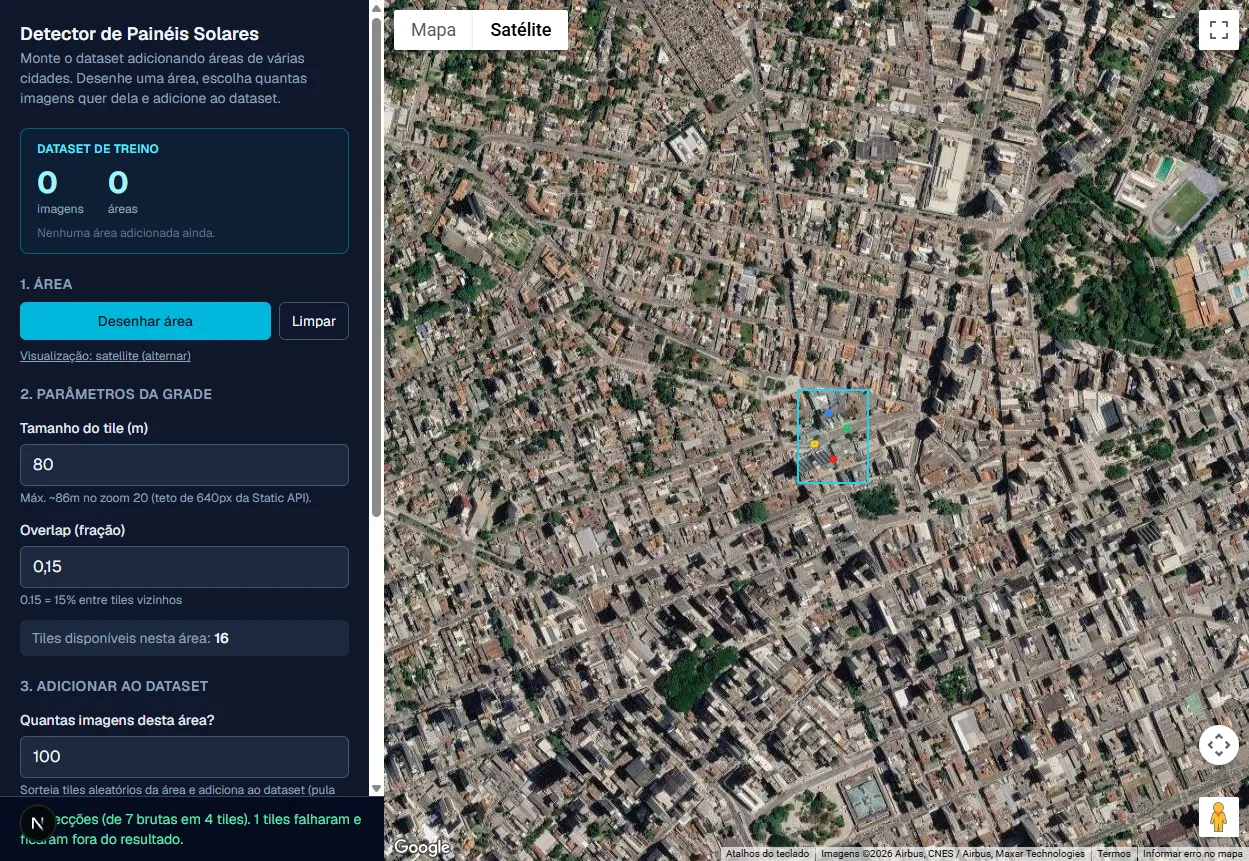
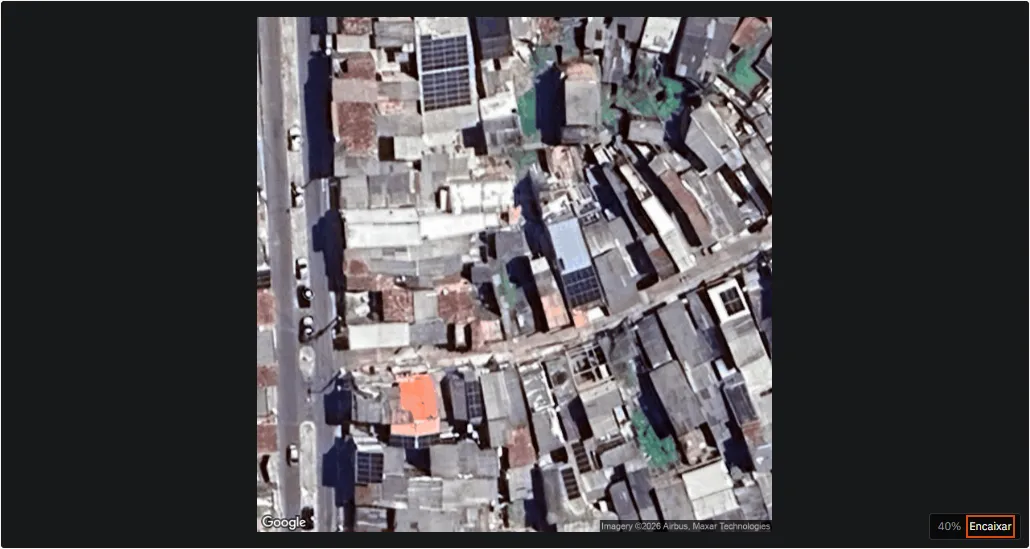
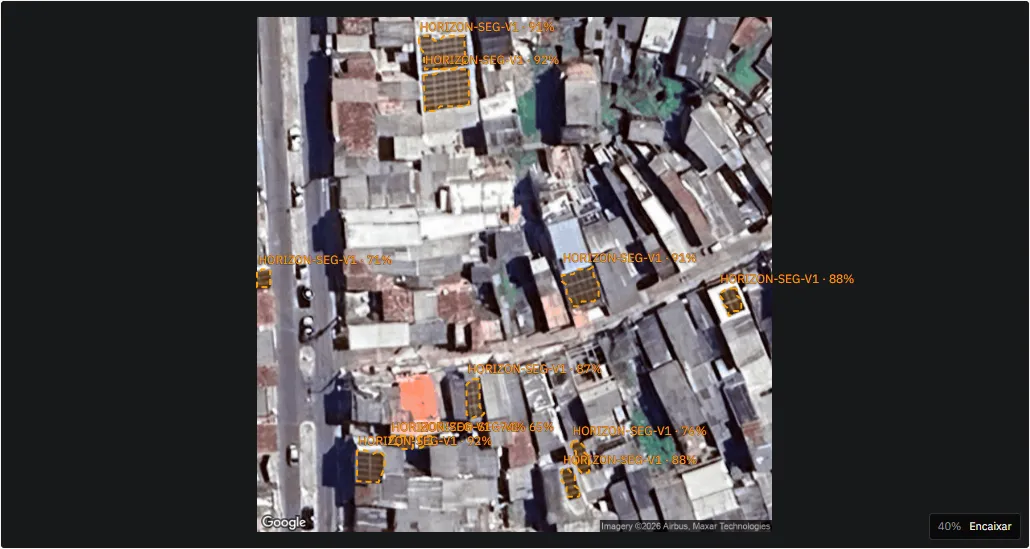
You draw an area on the map and the system returns, marked, every solar panel on that roof — in any city covered by satellite imagery.
0.887
the true mAP, after I found out my test set was contaminated
- Conditions
- 240 of the 270 images in the test set came from training · the memorized number was 0.997
- Role
- Author of the model and the proof of concept
- Context
- Started as my own project; Datlaz adopted it and turned it into a product
- Period
- 2026
- Status
- Adopted as a product by the company
The problem
Knowing how many roofs in a city already have solar power is an expensive question: someone has to look at them, one by one. I wanted to answer it from satellite imagery, at scale, for any region.
The user draws a free-form polygon on the map. The system covers the area with a grid of tiles measured in meters — not in pixels, so the scale doesn’t change with latitude — captures each tile, runs the detector, reprojects the boxes back to lat/long and merges everything with global non-maximum suppression. The color of each detection shows the confidence.
The decision that changed the project
The first model gave me mAP 0.997. A number like that is not a reason to celebrate; it’s a reason to be suspicious.
I checked the “frozen” test set: 240 of the 270 images were already in training. The model hadn’t learned to detect panels — it had memorized the answers to the exam. I redid the split and the true number showed up: 0.887.
Losing 11 points on a metric in a report is embarrassing. Finding that out after the model was already in production would have been much worse.
A second detail cost me hours: post-processing needs per-class sigmoid, not softmax. Softmax forces the classes to compete with each other and inference degrades quietly, without a single error in the log.
The result
I trained the detector on about 1,100 images from 10 areas across 8 Brazilian cities, at 6.7 cm per pixel. Datlaz, the company I contract for, adopted the model and turned it into a product.
The pipeline responds as a stream, with an actual per-tile progress bar, and tolerates partial failure: one tile that fails to load doesn’t bring down the whole analysis.
Where it runs
The model is served by the company itself, in ONNX, not by a paid detection API. The reason is arithmetic: on the hosted service every tile burned a credit, and sweeping a whole city means tens of thousands of tiles. Serving the model ourselves, the inference cost disappears and only the satellite image download remains — the review pilot in Brasília came out at roughly US$0.20 per run.
It isn’t an ideological choice; it’s what makes the numbers work at city scale. The same goes for training: the model in production cost $4.90 of rented GPU at $1.05/h, over 4 hours and 40 minutes.
It runs in production on the company’s cluster, behind single sign-on, serving a 115 MB model — about 0.1 second per tile on GPU, with CPU as the fallback.